Key takeaways
- A randomized Carnegie Mellon study found AI Overviews reduced outbound organic clicks by 39.8%, with no-click searches increasing by 34.5%.
- Chartbeat is the only product in this comparison with a published, publisher-specific engagement metric result. In its case, Deseret News’ headline testing increased click-through by 45%.
- Bloomreach, Optimizely, Amazon Comprehend, and IBM Watson Discovery each lack a published publisher-specific engagement or accuracy benchmark. Their case studies were completed in retail, e-commerce, or enterprise document discovery.
- Google Analytics 4 and Tableau Public both offer free versions of their products and no contract is needed to pilot the software before paying for it.
- No vendor in this space has published an independently-audited engagement-lift percentage across the publishing industry.
Introduction
Publishers that rely heavily on search traffic are seeing a surprising shift in practice. Researchers from Carnegie Mellon University, Saharsh Agarwal and Ananya Sen, conducted a randomized experiment on Google AI Overviews and found that the number of outgoing organic clicks dropped by an average of 39.8%, while the number of zero-click searches grew by 34.5%. According to the independent study performed by Authoritas (UK), the figure for desktop computers was 47.5%, while for mobile phones it was 37.7%. This data has been submitted to Google in the form of a competition complaint.
The traffic shift is precisely why ‘AI reader engagement’ solutions gained traction. If fewer users are going from a Google search to your content, you need to extract more value from those who do. The rub being the majority of vendor case studies for such tools are from retailers and e-commerce publishers and the few that do name a publishing client rarely mention if they continued to use the solution beyond the first quarter.
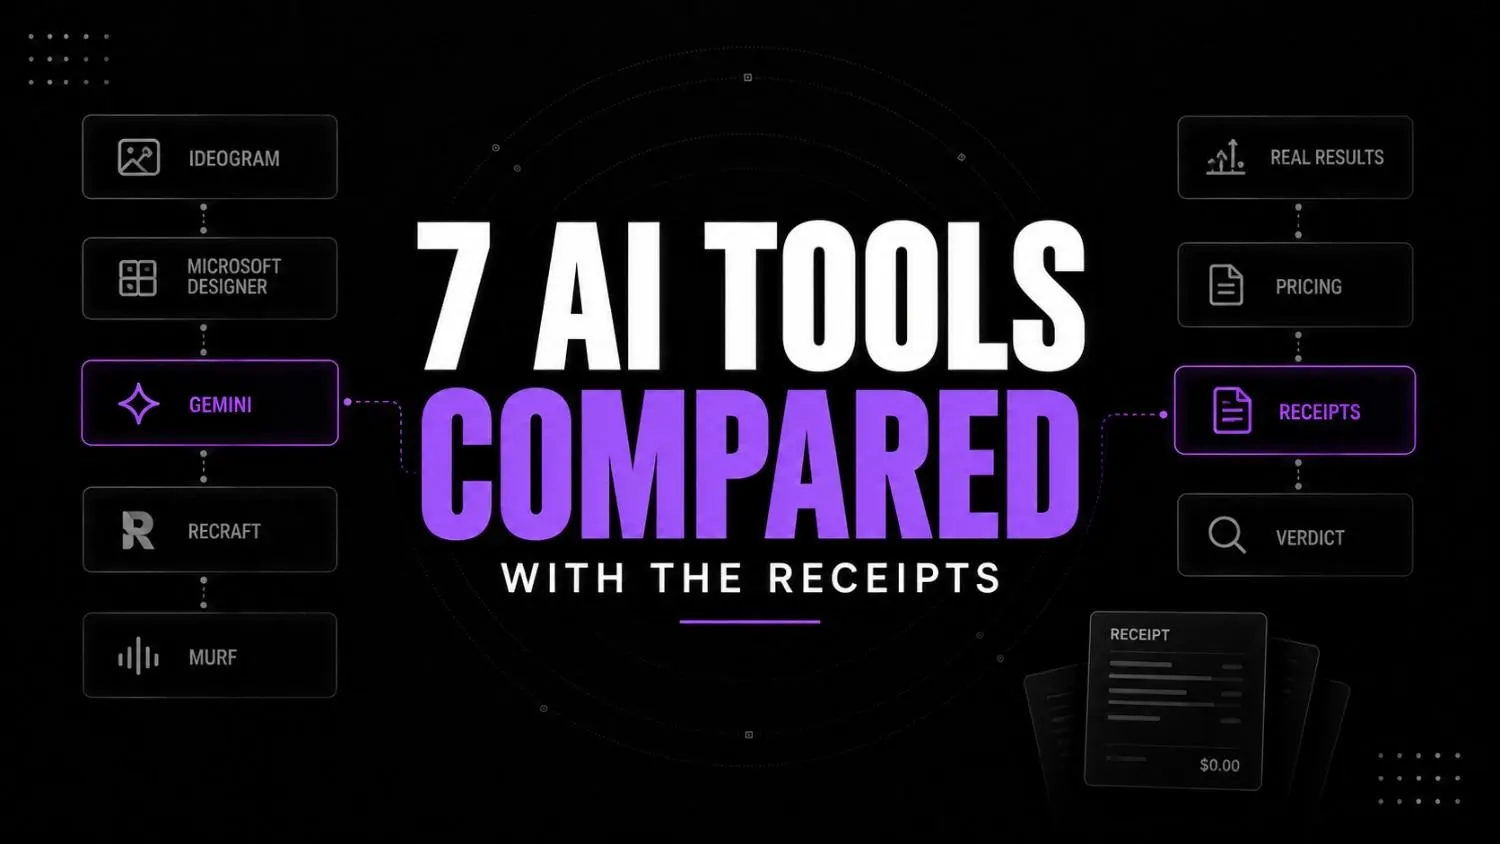
The comparison below covers seven tools publishers can use to improve engagement after visitors reach their sites using only results published by the vendors or a third-party with verified access (not marketing copy/paste or made-up percentages).
Direct answer: AI-driven tools designed to analyze the engagement of the readers through personalization, analytics dashboards, sentiment scores, etc. help keep the users who arrived at the site via search engaged for some more time. Of the seven tools, only Chartbeat has a published publisher-specific engagement result. The rest have proven products with case studies, but they do not specifically highlight traffic from publishing sources.
Quick answer: best AI tools for reader engagement
- Best documented result for publishers: Chartbeat, with a 45% CTR increase for Deseret News from headline testing.
- Best free starting point: Google Analytics 4, free to use and with engaged sessions built in.
- Best for data storytelling: Tableau Public, free and used by the BBC, CNBC, and the Wall Street Journal for data journalism.
- Best for commerce-heavy sites (proof is retail, not media): Bloomreach, which says it powers personalization for 1,400-plus brands.
- Best for teams already running A/B tests: Optimizely, with a documented 7% total-sales increase for an e-commerce client.
- Best for custom sentiment pipelines (developer required): Amazon Comprehend, pay-per-use with confidence scores returned for individual predictions.
- Best for internal document search, not reader engagement: IBM Watson Discovery, with a documented 75% cut in research time for an energy company’s internal archive.
Results still depend on publisher size, content type, and whether someone actually owns the tool after launch.
Why publishers need to rethink AI engagement tools in 2026
The problem: A growing number of searches are using AI Overviews, reducing the amount of referral traffic to publishers. According to the Carnegie Mellon study, zero-click searches increased by 34.5% when an AI Overview was present. Referral traffic has historically been an important source of visits for many publishers, but that traffic is under pressure.
The response most teams reach for: buy a personalization or analytics platform that will boost engagement on every visit, since you can’t really scale the number of visits. This is the point where you start buying every AI tool in sight and piling them on top of each other without realizing that any of the ones you previously bought might have been useless.
The catch: most engagement tools come with case studies from a different industry. A retail brand’s 7% increase in sales or 26% jump in average order value won’t tell you what the result would be on a publisher’s scroll depth or return-visit rate.
Pause and think: when was the last time you were shown an engagement percentage that came from a company in your own industry instead of a similar one?
Seven AI tools for reader engagement
1. Bloomreach
What it does: AI-driven personalization engine for content and product recommendations. Documented result: Bloomreach says it powers personalization for 1,400-plus brands, with case studies spanning retail, travel, sports and media, and other industries. Best for: Publishers that already have a strong commerce or subscription-upsell layer. Key features: real-time behavior tracking, dynamic recommendations, email personalization, cross-channel orchestration. Pricing: custom, quote-based, based on customer volume and event count. Implementation: usually takes several weeks to a few months for enterprise onboarding. Verdict: a proven platform, but there’s no publisher-specific number here to lean on. Run it through a proper vendor evaluation and ask for a media-industry reference before signing.

Bloomreach
Bloomreach is a customer experience platform built for commerce teams. It combines AI-powered marketing automation, personalization, customer data, site search, merchandising, and conversational shopping to help brands turn customer behavior into more relevant experiences.
2. Chartbeat
What it does: Tracks user behavior on a minute-by-minute basis, specifically for newsrooms. Documented result: Deseret News experimented by using Chartbeat’s headline-testing feature and saw a CTR increase of over 45% a month for live stories. Literally Media used image testing and saw a 14% decrease in bounce rate and about a 15% increase in click-through rate Best for: newsrooms making same-day editorial decisions. Key features: live dashboard, scroll-depth tracking, headline and image A/B testing. Pricing: not publicly listed; independent estimates put entry plans around $500 to $1,000 a month, with larger newsrooms paying into the thousands. Implementation: fast, often live within one to two weeks. Verdict: probably the clearest publisher-specific proof here, but those gains only happen if someone is actually running tests every week.

Chartbeat
Chartbeat is a content analytics platform designed for publishers and digital media teams. It tracks reader engagement across websites and native apps so editorial teams can understand what content is performing and make faster publishing decisions.
3. Optimizely
What it does: Experimentation and personalization platform built on top of A/B testing. Documented result: a wall-art e-commerce retailer, K&L Wall Art, recorded a 7% increase in total sales, an 8.3% conversion rate lift, and a 26% rise in average order value after adding recommendation modules. This is a retail result, not a publishing one. Best for: teams that already run structured experiments and want to extend that into content. Key features: multivariate testing, audience segmentation, AI-assisted recommendations. Pricing: enterprise, quote-based, historically starting in the tens of thousands annually. Implementation: typically six to ten weeks for a full personalization rollout. Verdict: makes sense if experimentation is already part of the workflow. If your team has never really run A/B tests, there’s a learning curve here, both with the tool and the process behind it. Treat the retail case study as a starting question for evaluating the vendor, not a promise.

Optimizely
Optimizely is a digital experience platform with experimentation, personalization, content, commerce, and marketing capabilities. Its experimentation products use AI to help teams generate ideas, run tests, analyze results, and optimize customer experiences.
4. Amazon Comprehend
What it does: AWS natural language processing API for sentiment scoring, entity recognition, and key phrase extraction. Documented result: AWS gives you per-prediction confidence scores rather than one fixed accuracy number. In practice, accuracy depends on the type of text you’re running through it. Best for: technical teams building custom sentiment analysis into an existing content pipeline. Key features: real-time sentiment scoring, entity recognition, custom model training, free tier for testing. Pricing: pay-as-you-go, priced per unit of text processed. Implementation: two to four weeks, and you’ll need a developer. Verdict: genuinely useful, but remember it’s an API, not a dashboard. Without engineering time behind it, it doesn’t do much on its own.
Amazon Comprehend
Amazon Comprehend is an AWS natural language processing service that analyzes text using machine learning. Developers can use its APIs for sentiment analysis, entity recognition, key phrase extraction, language detection, custom classification, and custom entity recognition.
5. IBM Watson Discovery
What it does: Enterprise document search and NLP, built for financial, legal, and insurance document review. Documented result: IBM’s published material highlights enterprise document search and knowledge discovery use cases, but this comparison does not have a verified publisher-specific engagement number to cite. Best for: publishers with large internal research or investigative archives. Key features: faceted search, entity extraction, custom entity training, OCR. Pricing: plans start around $500 a month; enterprise pricing is quote-based. Implementation: four to eight weeks. Verdict: it shows up in “AI for publishers” lists largely because of the Watson name. It isn’t primarily built to predict what a public reader wants to read next.

IBM Watson Discovery
IBM Watson Discovery is an enterprise document-understanding and information discovery platform. It uses natural language processing, document understanding, search, OCR, and language models to help organizations extract information from large collections of business documents.
6. Google Analytics 4
What it does: Free analytics platform measuring engaged sessions, defined as a session lasting 10 seconds or longer, containing two or more pageviews, or including a key event. Documented result: GA4 is a measurement tool, not a personalization engine, so Google doesn’t publish an engagement-lift percentage. Its value comes down to how well you set it up and what you actually do with the data. Best for: any publisher establishing a baseline before paying for anything else. Key features: custom event tracking, engaged-session reporting, audience segmentation. Pricing: free for standard properties; GA4 360 is quote-based for enterprise volume. Implementation: about one to two weeks for a technical team. Verdict: The right place to start for every publisher on this list, whether you end up paying for another tool or not.
Google Analytics
Google Analytics is a widely used web analytics platform that helps businesses track website and app performance. It’s designed for marketers, website owners, and analysts who want to understand user behavior and improve conversions.
7. Tableau Public
What it does: Free interactive data visualization tool for building data stories. Documented result: used by the BBC, CNBC, the Wall Street Journal, and La Nación for published data journalism; used widely for published data journalism. There’s no general “comprehension boost” percentage published. Best for: publishers with a recurring data-story or explainer format. Key features: interactive dashboards, embeddable visualizations, free storage tier. Pricing: ffree for public visualizations. Implementation: same day to about a week for a single visualization. Verdict: excellent for a specific content format. But if you don’t have a recurring data-journalism workflow, it becomes a one-off project tool rather than an ongoing engagement system.
Tableau Public
Tableau Public is a free platform for creating, exploring, and publicly sharing interactive data visualizations. It is especially useful for learning data visualization, building analytics portfolios, publishing public data stories, and discovering work from the Tableau community.
Comparison table
| Tool | Verified result | Best for | Pricing | Implementation |
|---|---|---|---|---|
| Bloomreach | No publisher-specific figure published | Commerce-heavy publishers | Custom quote | Weeks to months |
| Chartbeat | 45% CTR lift (Deseret News) | Real-time newsroom decisions | ~$500 to $5,000+/month | 1 to 2 weeks |
| Optimizely | 7% sales lift (retail case, not publishing) | A/B testing culture | Custom quote (enterprise) | 6 to 10 weeks |
| Amazon Comprehend | Per-prediction confidence score, no fixed accuracy | Custom sentiment pipelines | Pay-per-use | 2 to 4 weeks |
| IBM Watson Discovery | 75% research-time cut (document search, not engagement) | Internal archive search | From ~$500/month | 4 to 8 weeks |
| Google Analytics 4 | N/A, measurement only | Free baseline for every publisher | Free (360 tier quote-based) | 1 to 2 weeks |
| Tableau Public | 1B+ visualization views industry-wide | Data journalism | Free | Same day to 1 week |
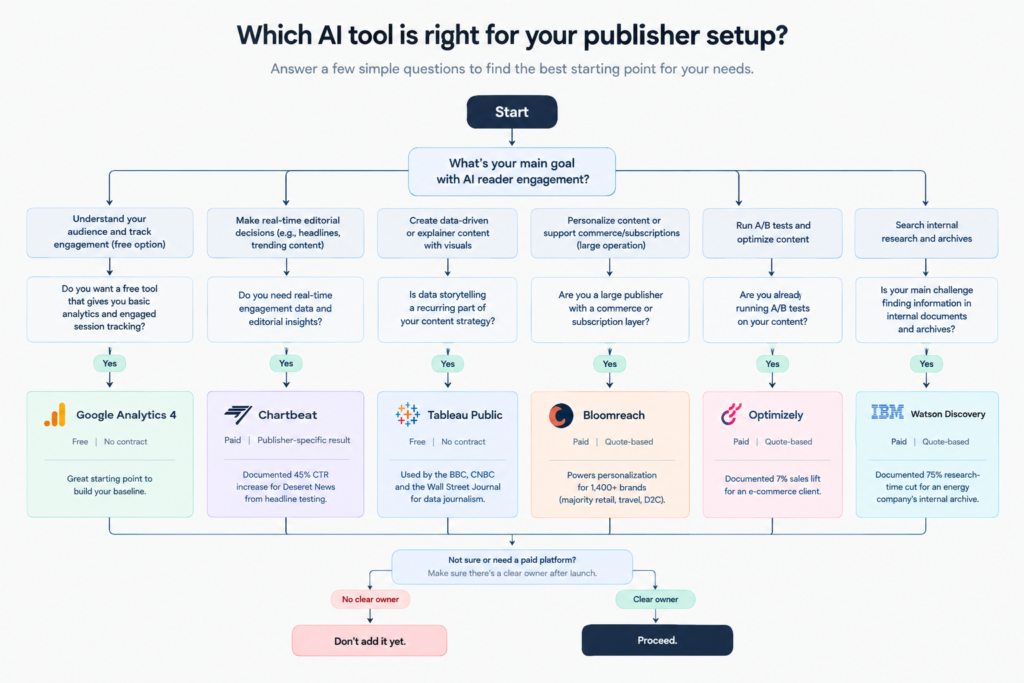
How to choose
Publisher
↓
Small publisher/startup?
↓
YES → GA4 → Build baseline
↓
Real-time editorial decisions?
↓
YES → Chartbeat
↓
Large publisher + personalization needs?
↓
YES → Bloomreach / Optimizely
↓
Recurring data storytelling?
↓
YES → Tableau Public
↓
Research/archive-heavy team?
↓
YES → IBM Watson Discovery
↓
Paid tool?
↓
Clear owner after launch?
↓
NO → Don't add it yet
YES → Proceed
Implementation checklist
- Weeks 1 to 2: install or verify GA4. Record baseline engagement rate, time-on-page, and scroll depth before changing anything.
- Weeks 3 to 4: if adding Chartbeat, start headline or image testing on a subset of stories. Track results against your GA4 baseline, not a vendor’s advertised number.
- Weeks 5 to 8: if piloting Bloomreach or Optimizely, run it against a holdback group and require a documented media-industry case study first.
- Ongoing: assign one named person to review each tool’s assumptions every quarter, especially after any CMS, taxonomy, or redesign change.
Run this list as a lightweight workflow audit before any renewal, not just before a new purchase.
Self-audit before buying:
- Can you name the person who owns this tool 90 days after launch?
- Does your review meeting have a dedicated slot for this tool’s metric?
- Did the vendor’s case study come from a publisher, or a different industry?
- Would you notice within a month if this tool quietly stopped working?
If you answered no twice or more, the tool isn’t your problem. The workflow around it is.
FAQs
Chartbeat was initially designed for newsrooms, and the company published case studies about media outlets as its primary customers. Other platforms are aimed at a more extensive audience, such as retail and enterprise businesses, and thus have examples from these industries.
An increase in sales indicates that the recommendation system works correctly, but this metric does not reflect the value of an article. This metric should be used to evaluate how relevant vendors’ testing methodology is, not what changes in traffic it will bring to the publisher.
It depends on how much the traffic to the domain is now. Google’s Analytics 4 and Tableau Public are free to use, so it makes sense to try them to check whether there is an issue with engagement rather than dive into expensive solutions that require a long-term commitment.
In most cases, such tools stop working due to specific reasons, such as a change in content taxonomy, layout, or team members, and there is no one to notice it for a long time. This is the same pattern behind most failed AI adoption: not a bad tool, but no one left holding it after launch.
Yes, but it needs to be configured around the events and dimensions that matter to the publication. GA4 can show engaged sessions and user behavior, but it doesn’t automatically decide which editorial changes will increase engagement.
Use GA4 when you need a broader measurement baseline across the site. Chartbeat makes more sense when the newsroom needs real-time editorial signals and wants to test headlines or images during the publishing cycle.
Ask for a case study from a publisher with a similar audience, content model, and traffic scale. Then ask exactly which metric improved, how long the test ran, what the comparison group was, and who owned the system after launch.
Conclusion
The companies that thrive this year will not be those that deploy the most artificial intelligence tools, but those that can name one specific person accountable for each tool three months after the invoice has cleared. Ask yourself which of your current tools would fail that test.
Your next move
Grab your GA4 dashboard and show me the ratio of engaged sessions over the past 30 days compared to the 30 days before that. If no one on your team has done this analysis this month, you’ve just found the one change to make before buying another analytics tool.